Last updated:2026-10-13
comments: true keywords: Valgrind Massif C++,heap profiling,ms_print,peak memory description: "Profile C++ heap use with Valgrind Massif: a reproducible example, command flags, how to read ms_print peak snapshots, and what the measurements exclude." title: Valgrind Massif for C++: Find Peak Heap Use | C++那些事
Valgrind Massif: find where C++ heap memory peaks
Massif records heap usage over a program run and writes snapshots to massif.out.<pid>. ms_print turns the snapshots into a graph and allocation tree. This helps answer when memory peaks and which allocation paths contribute; it does not by itself diagnose a leak. Valgrind is commonly used on Linux; the commands below assume it is installed in that environment.
A small program to profile
#include <cstddef>
#include <vector>

int main() {
    std::vector<char> first(1'000'000, 'a');
    std::vector<char> second(2'000'000, 'b');
    volatile std::size_t live = first.size() + second.size();
    return live == 3'000'000 ? 0 : 1;
}
Compile with debug symbols and run the profiler:
c++ -std=c++17 -g -O0 massif_demo.cpp -o massif_demo
valgrind --tool=massif --time-unit=B --massif-out-file=massif.out.%p ./massif_demo
ms_print massif.out.* | less
For a short program, --time-unit=B uses allocated/deallocated bytes for the horizontal axis instead of the default instruction count. It does not change the vertical memory unit. The output filename includes the process ID, so use the matching file if several runs are present. Compile the real target with symbols to make allocation stacks easier to read.
Interpret the report
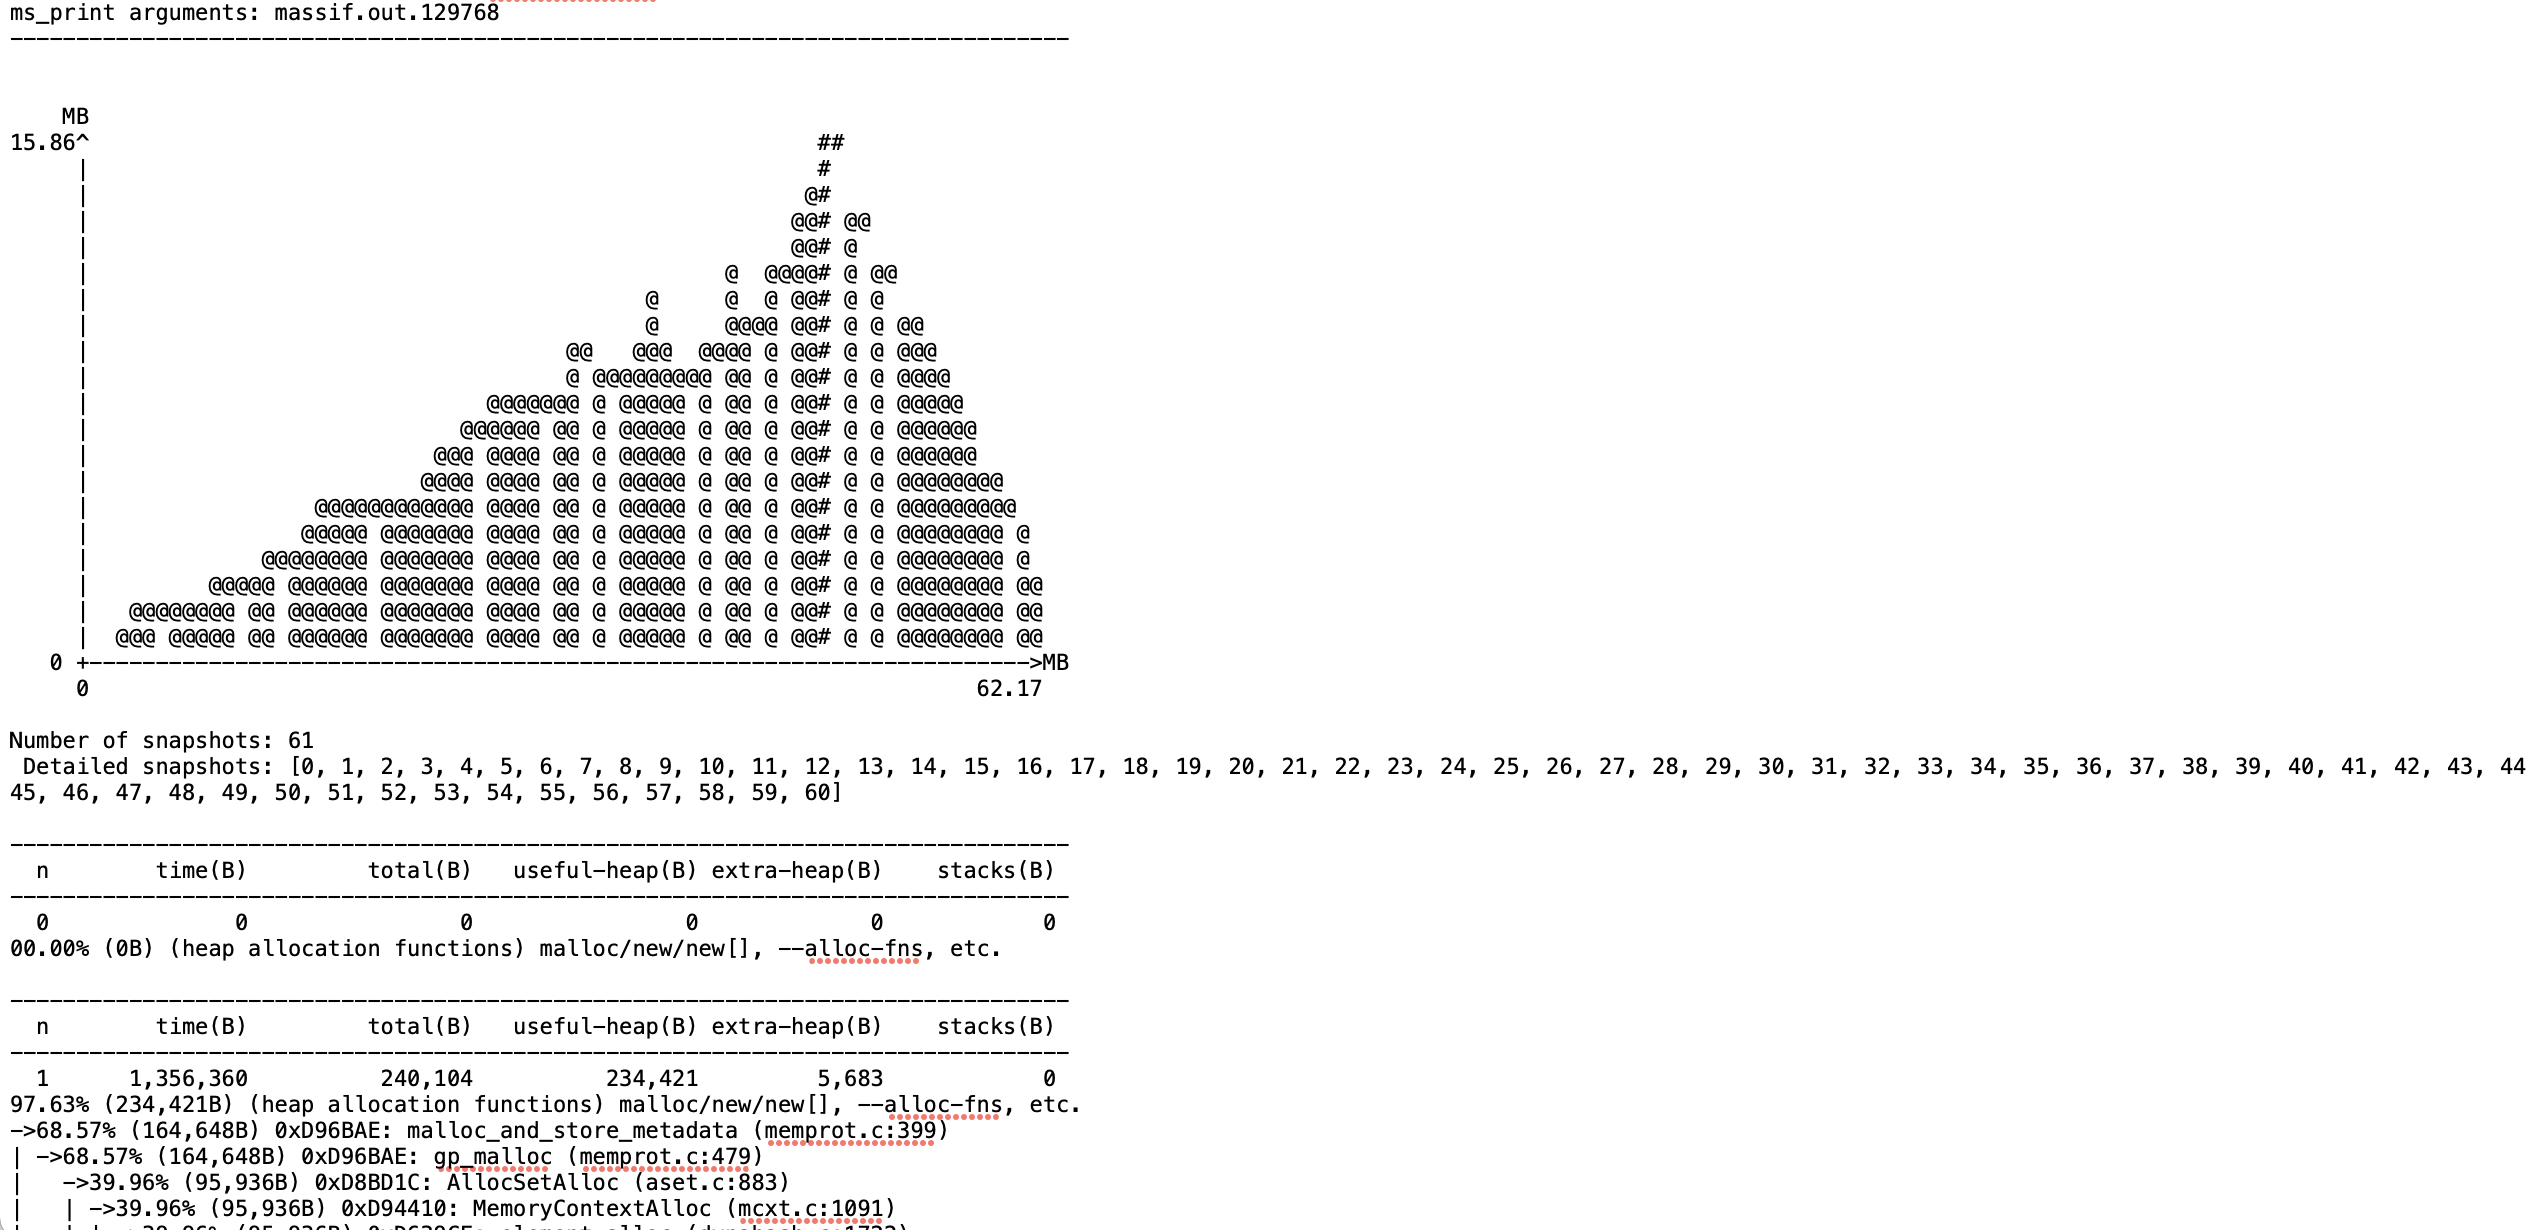
- Locate the snapshot marked peak and read its total bytes. The graph shows how usage changes during the run, not an operating-system RSS measurement.
- Inspect the peak allocation tree below the graph. It attributes requested heap bytes and allocator overhead to call paths; the two vectors in this example should appear through allocation functions.
- Compare equivalent runs after changing one thing. Keep input, build flags, allocator and profiling options the same. Valgrind slows execution, so do not treat this run as a speed benchmark.
By default Massif profiles the heap; stack profiling is off. Enable --stacks=yes only if stack usage is part of your question. --detailed-freq=1 requests more detailed snapshots and increases profiling overhead; use it when the default output lacks enough allocation detail. Some custom allocators and memory mapped regions require additional interpretation; consult the official Massif manual before treating the total as all process memory.
Original project workflow
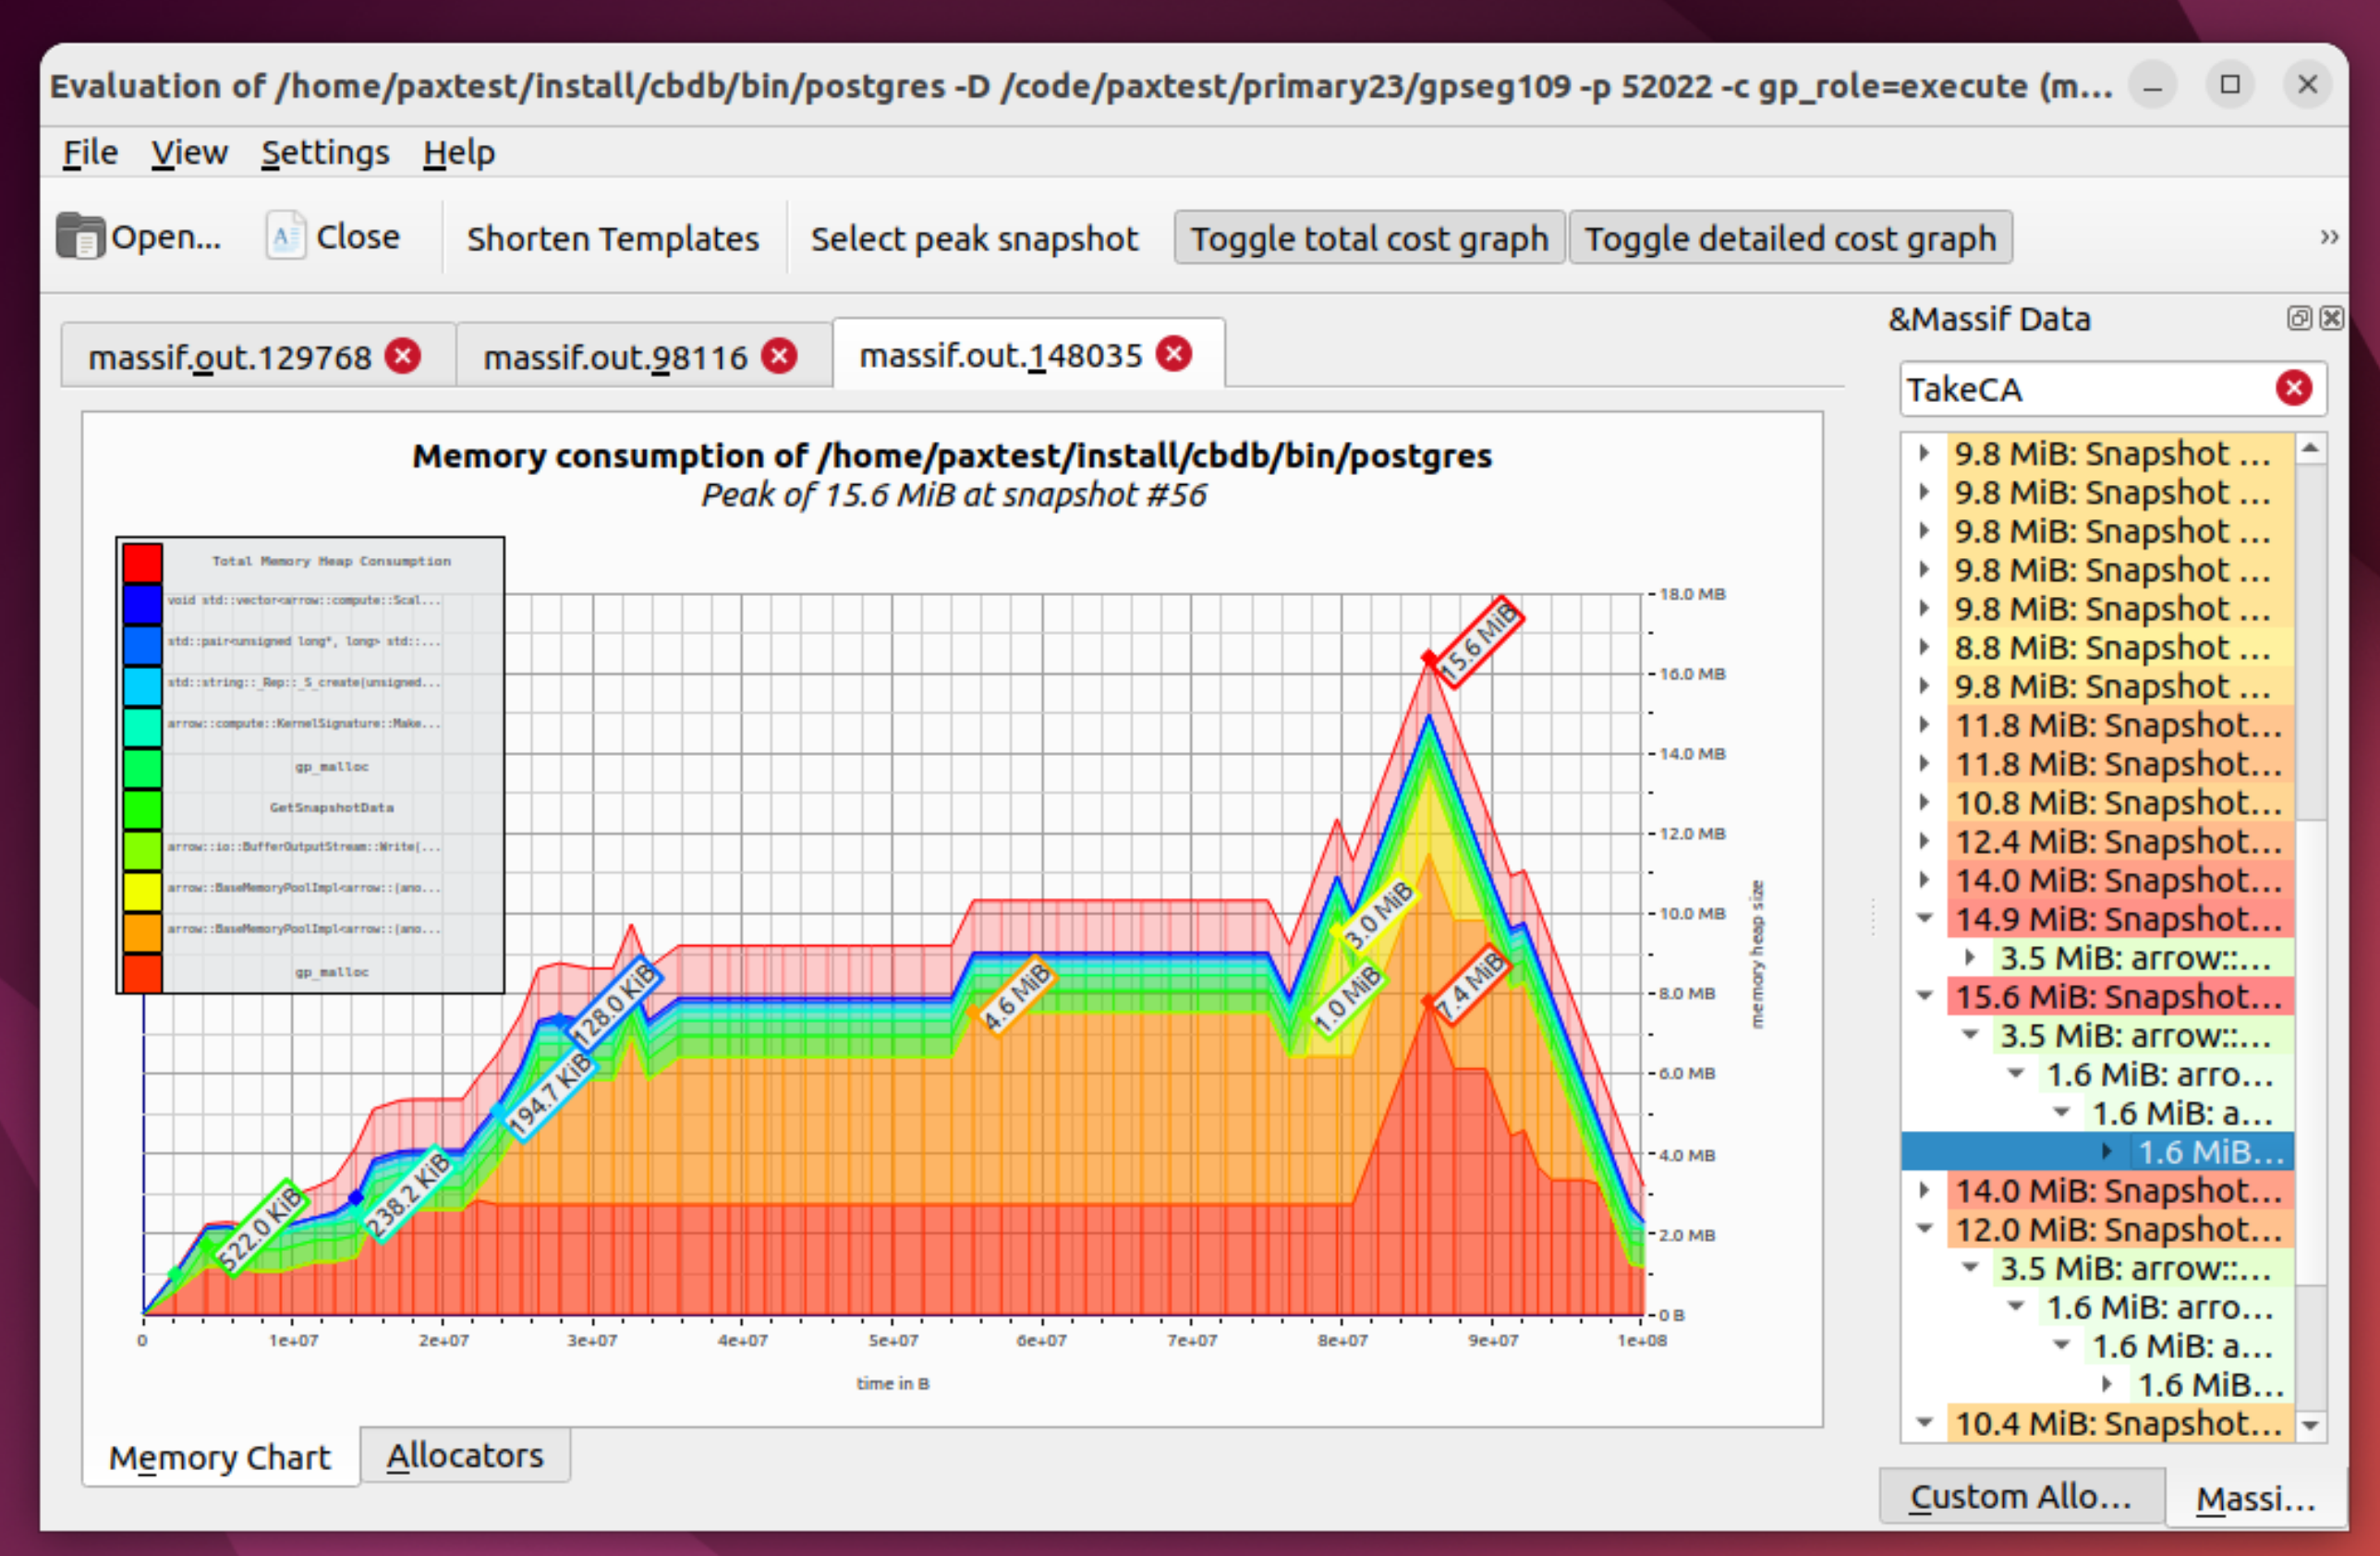
The project also used a gpstart wrapper for one workload. Its arguments depend on that project's runtime, so start with the standalone valgrind command above. The screenshots below show the earlier workflow and an ms_print report; their values are examples, not reproducible results for your machine.
For a contrasting microbenchmark problem, see lookup tables and benchmark pitfalls. For detecting invalid memory access, see AddressSanitizer.