Last updated:2026-10-12
C++ Memory Leak Detection
How to check memory, from C++那些事
When we write C/C++ code, memory problems are everywhere; both at work and in interviews, the topic of memory is inescapable.
Today, using one example, we will get hands-on with valgrind for checking C++ memory, step by step.
Three problems are simulated:
- Detecting an invalid memory release
- Detecting a write overflow
- Detecting a read overflow
You will learn:
- How to detect these three problems
- How to debug with gdb + valgrind together
Feel free to join the discussion.
1. A sample to start with
Take a look at the code below; we will find quite a few problems:
- strcpy is unsafe — no matter how large the memory is, it may overflow
- msg is accessed out of bounds when printing
- The destructor does not release memory
Doesn't it look just like code you once wrote yourself? Ha.
This section will detect these problems.
class Message {
private:
    char *msg;

public:
    Message(const char *text) {
        msg = new char[3];
        std::strcpy(msg, text);
    }

    void printOutOfRange() {
        std::cout << msg[5] << std::endl;
    }

    ~Message() {

    }
};

int main() {
    Message message("hello");
    message.printOutOfRange();

    return 0;
}
2.valgrind
Installing valgrind:
For installation on more systems, see the official site:
3. Usage
First, when compiling, it is recommended to use debug, -g, so that you can detect which line of the code has the problem.
Then we execute:
We then get the information valgrind gives us:
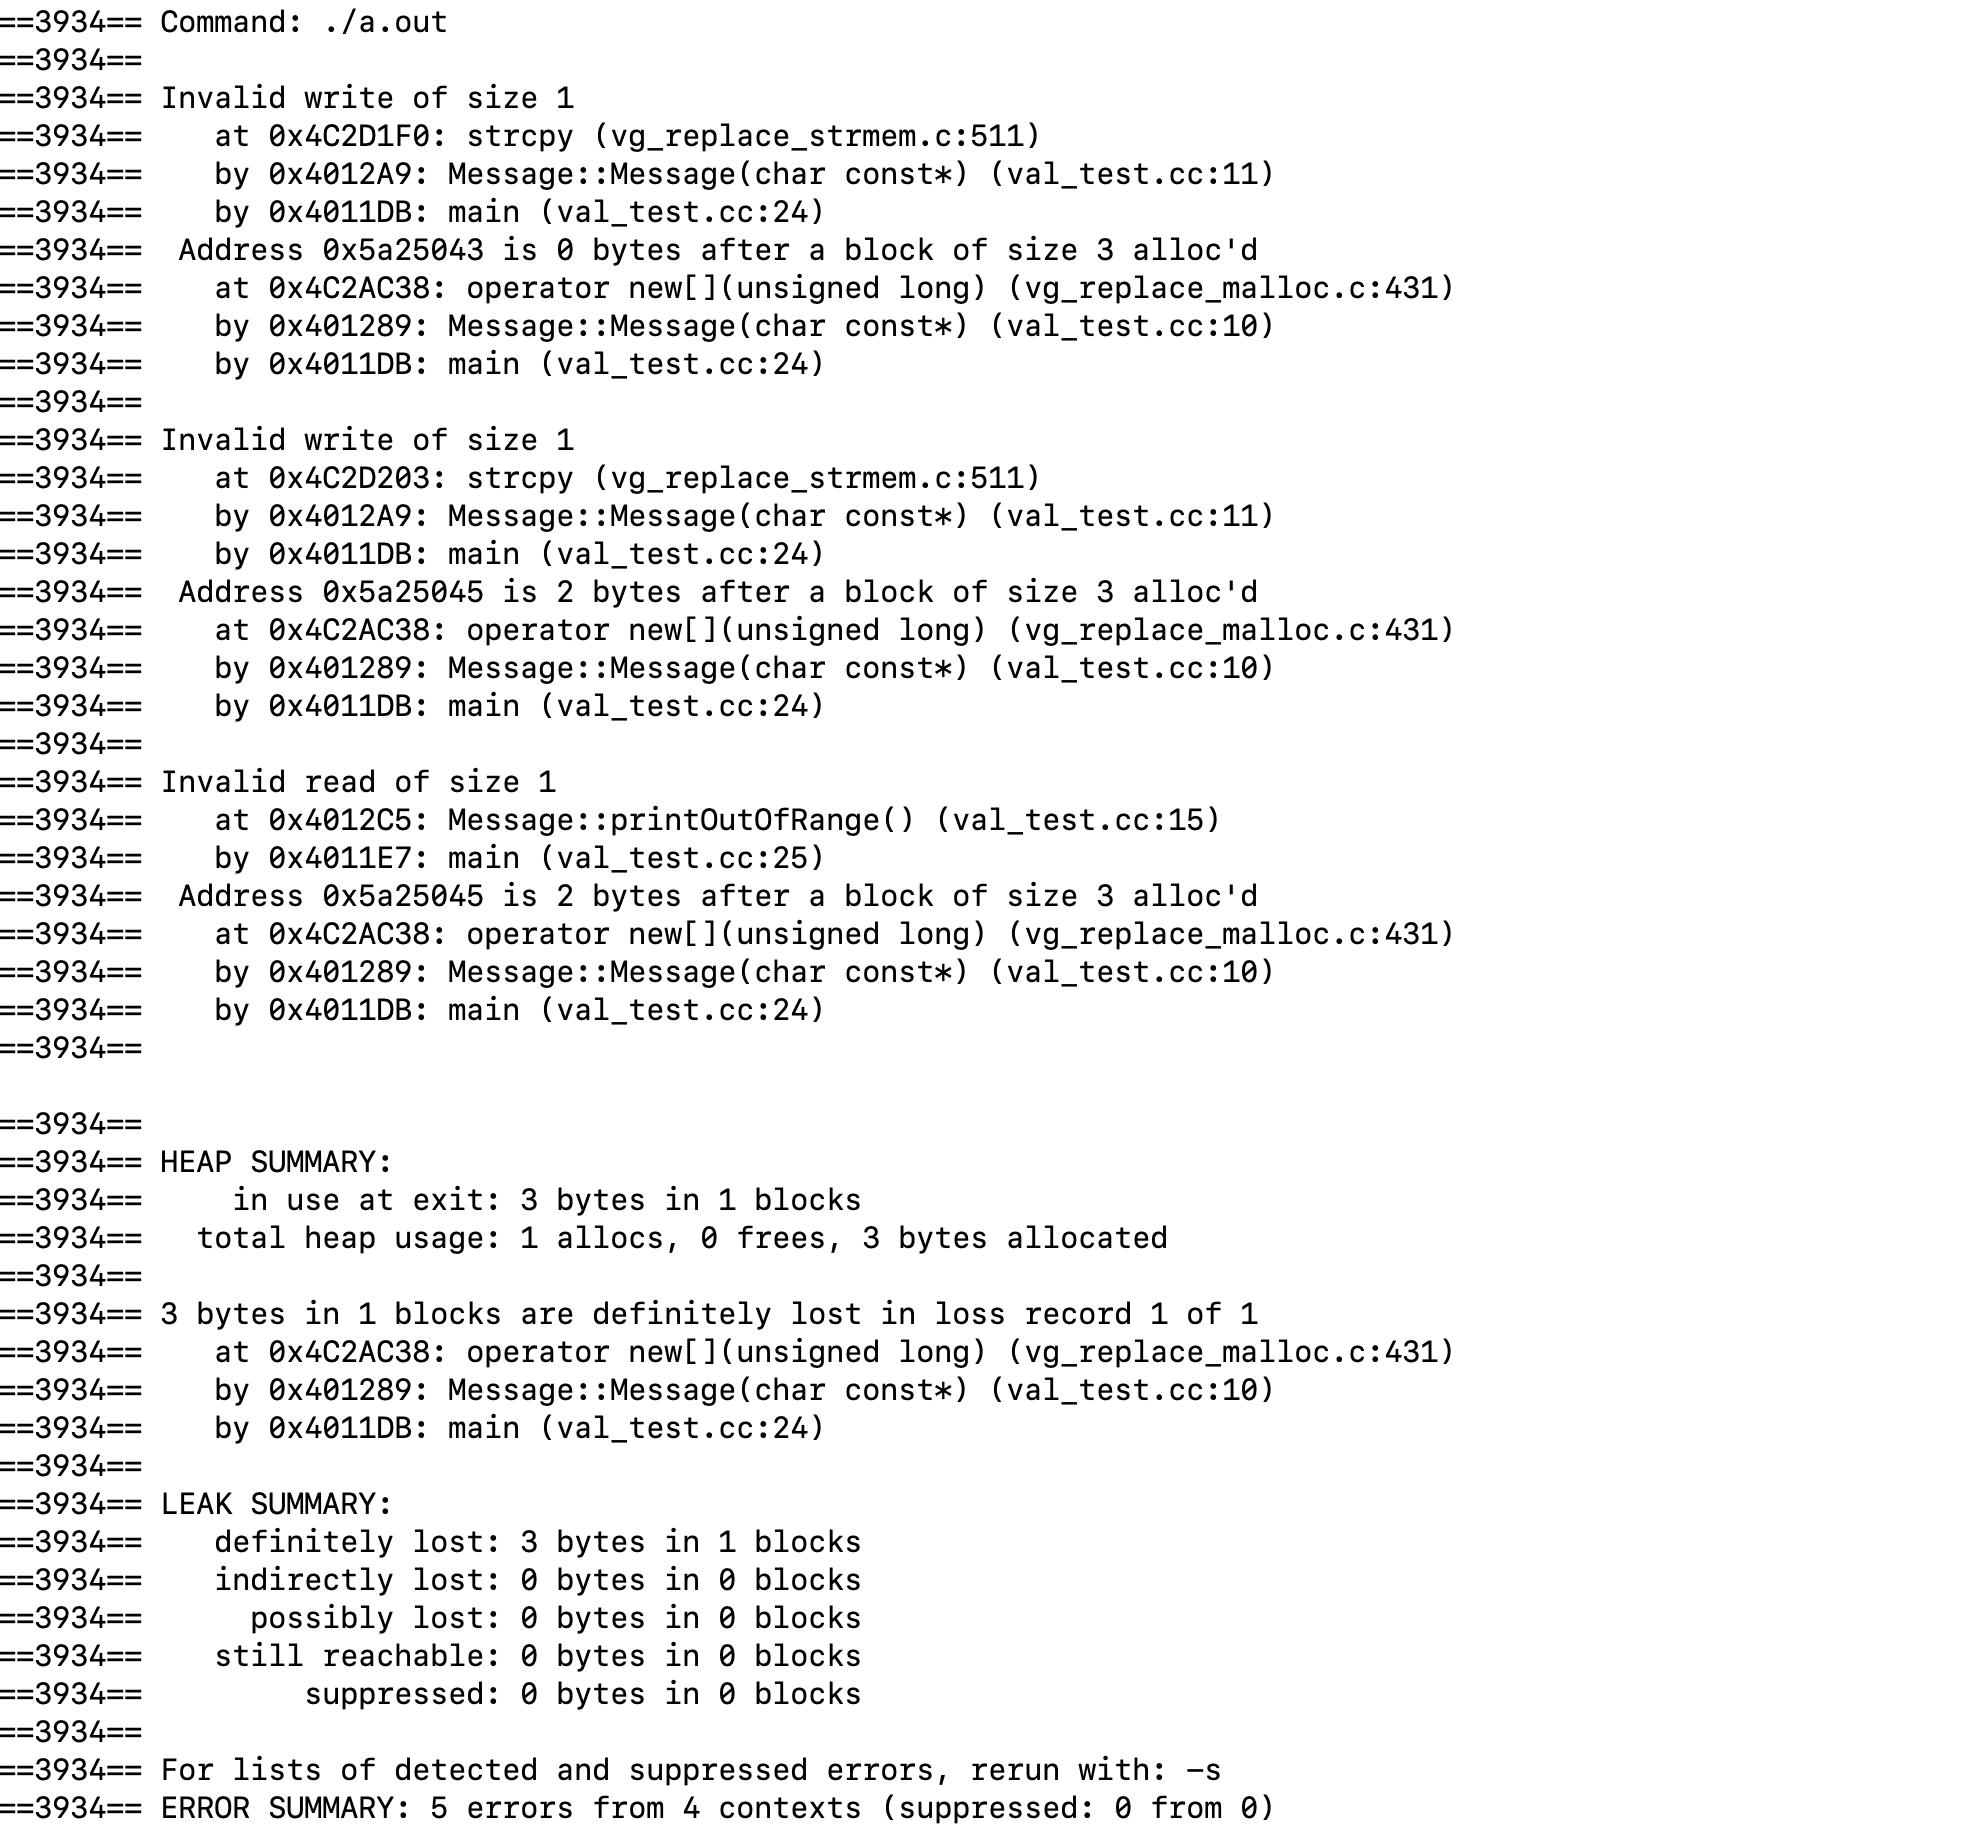
At this point, we can see several problems above:
- Invalid write
Occurs at val_test.cc::11
- Invalid read
Occurs at val_test.cc:10
- Memory leak
1 allocs, 0 frees, 3 bytes allocated.
This information lets us quickly locate which line of code has the problem.
4. Debugging with gdb
When we add --vgdb-error=0, we can debug the code very conveniently — debugging on one side while seeing where the problems are.
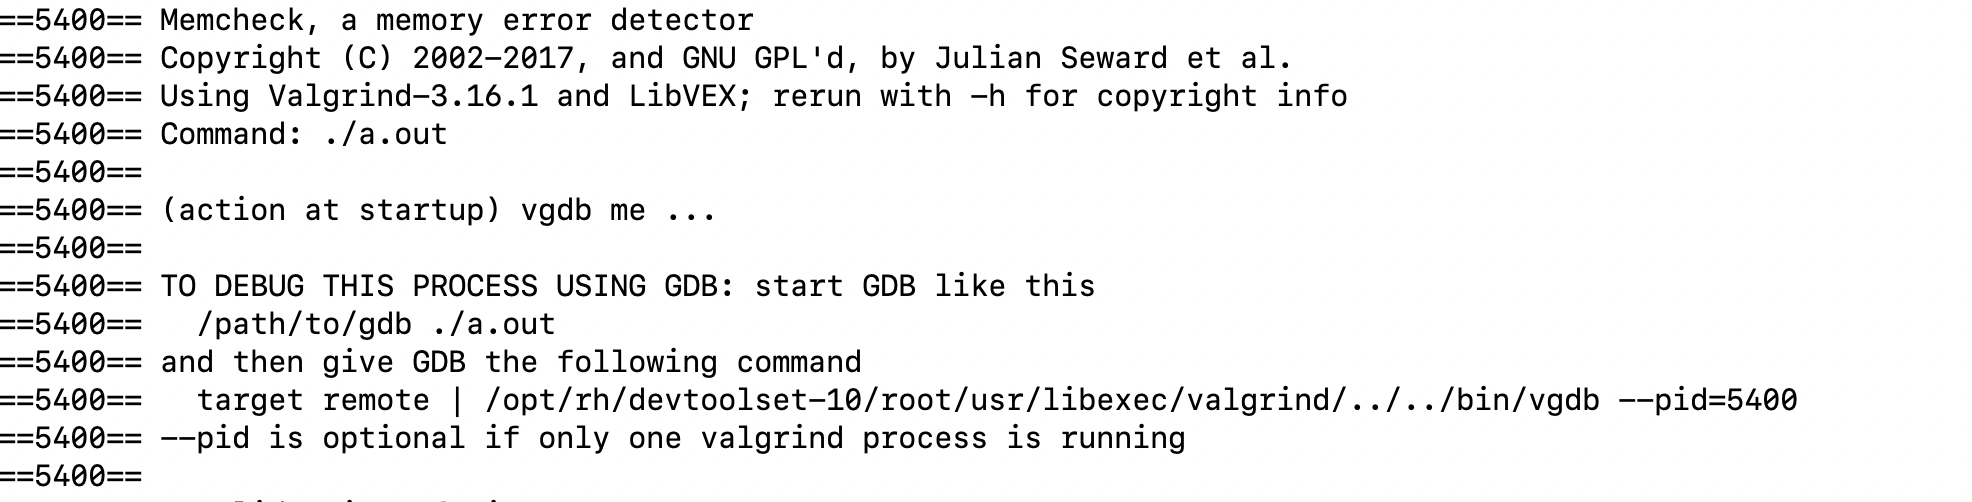
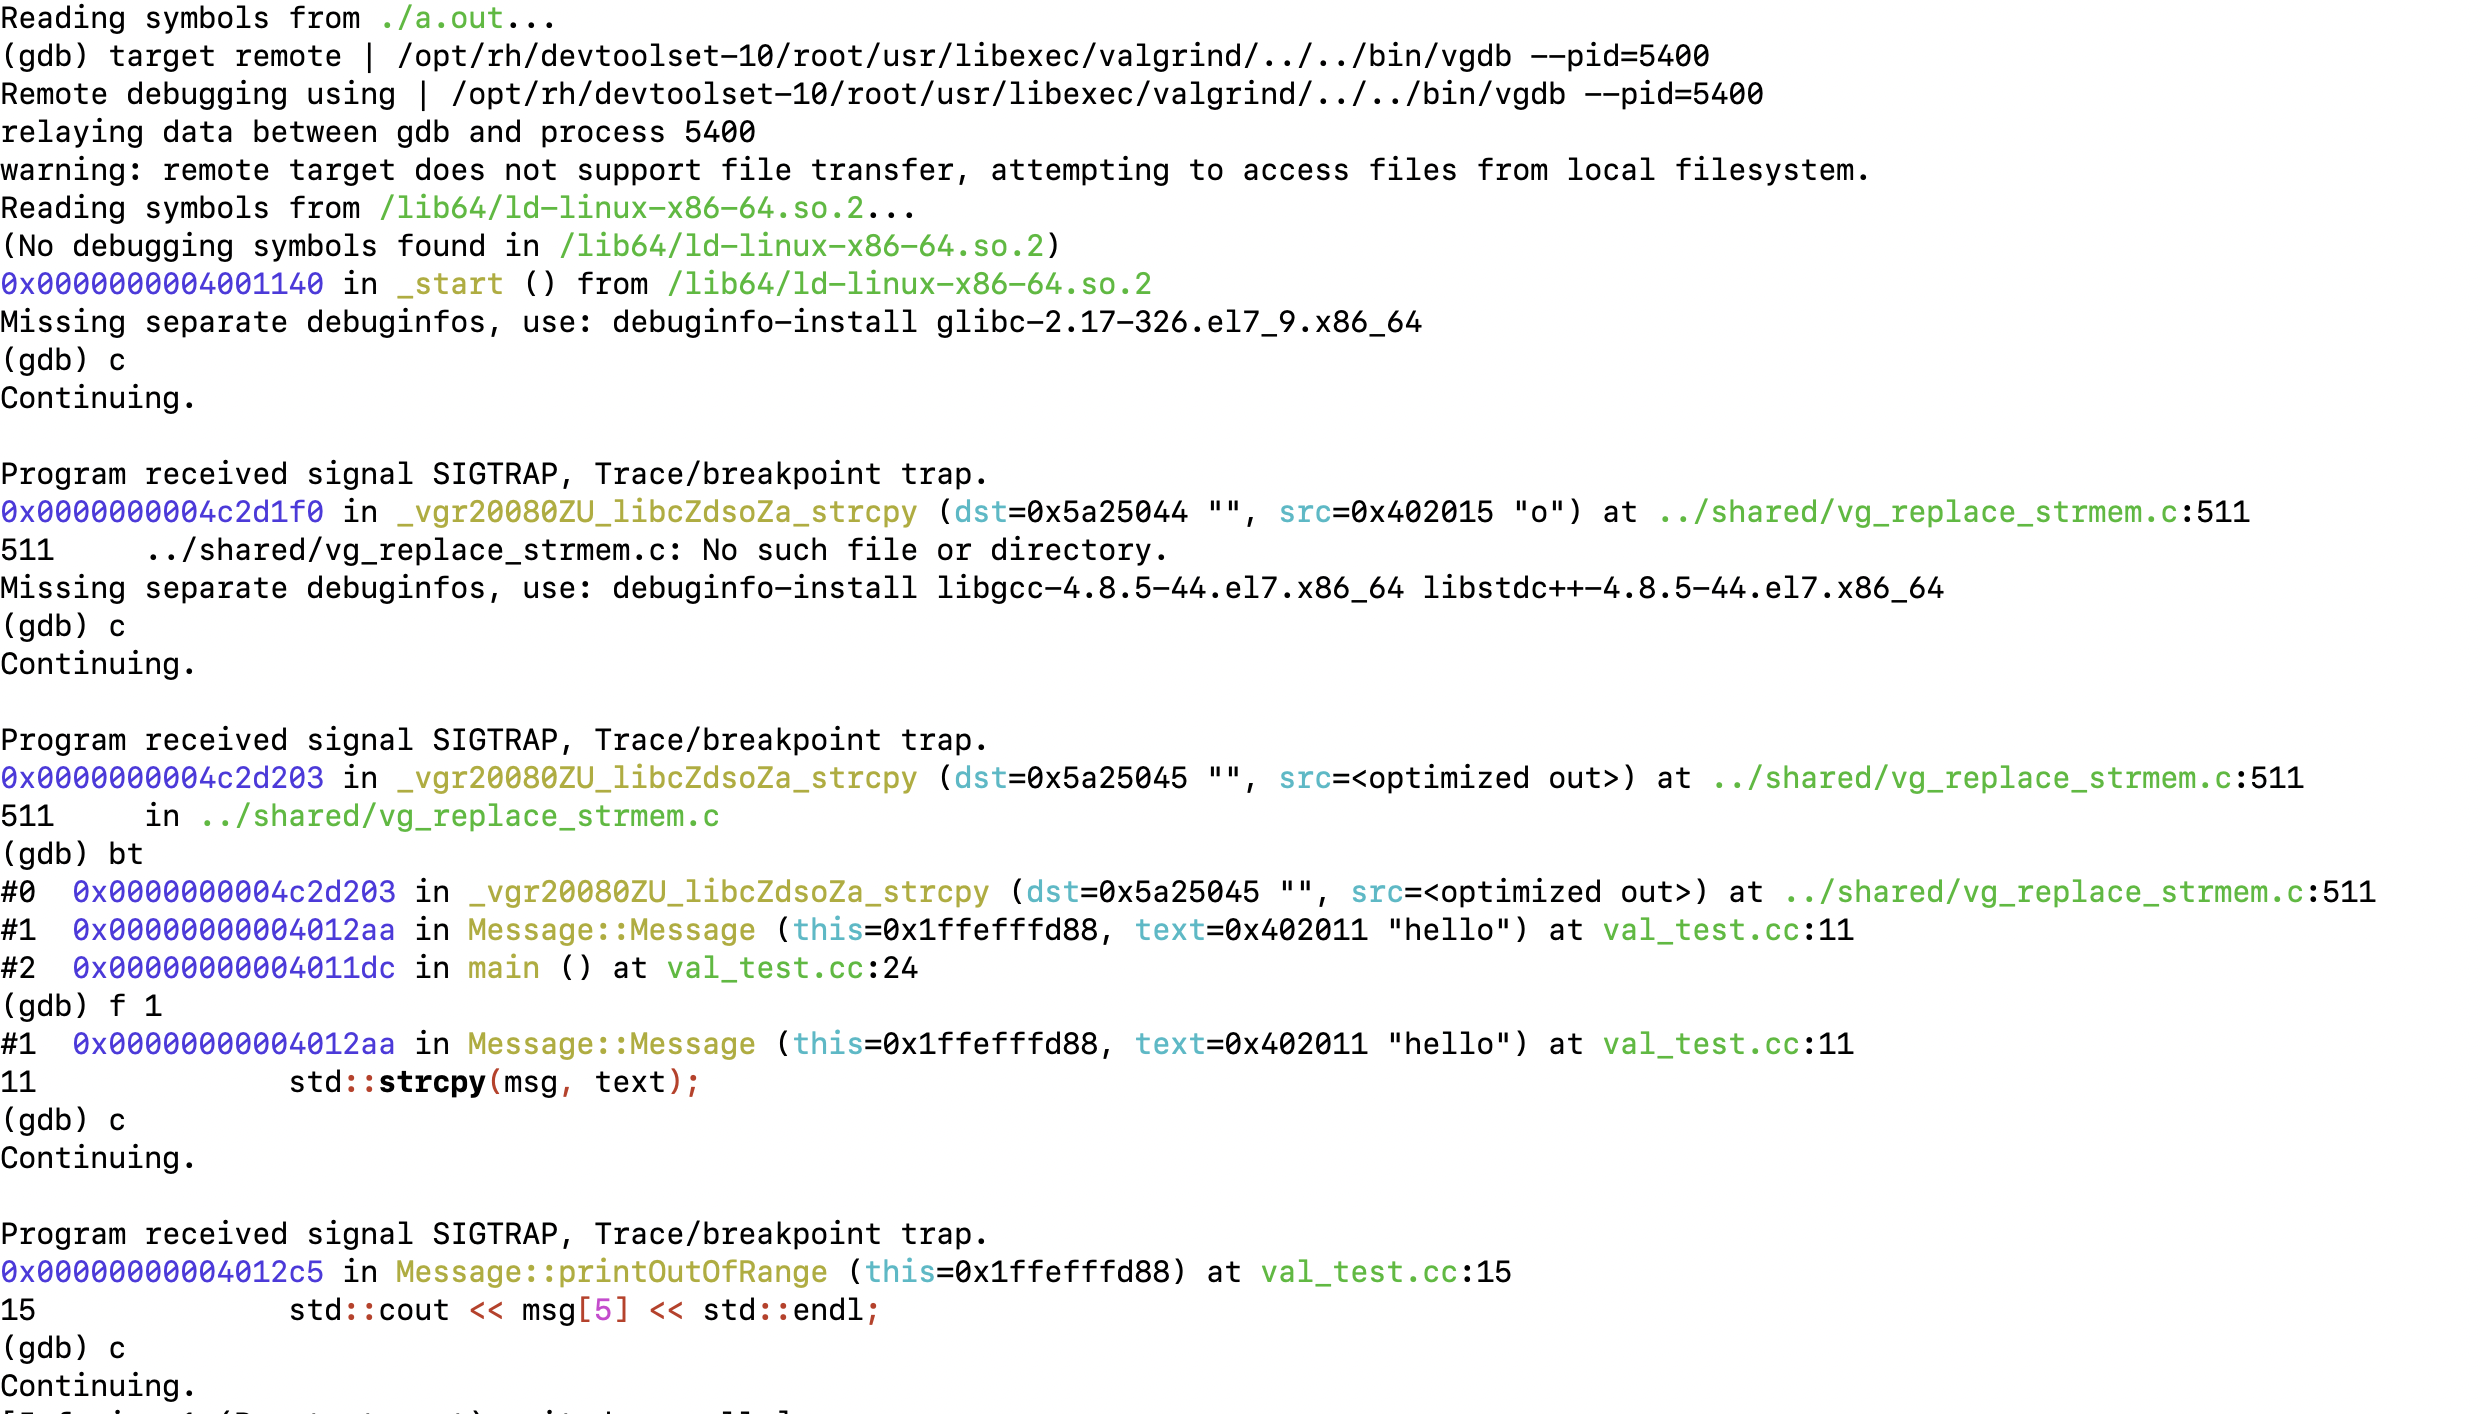
Afterwards, we attach with gdb
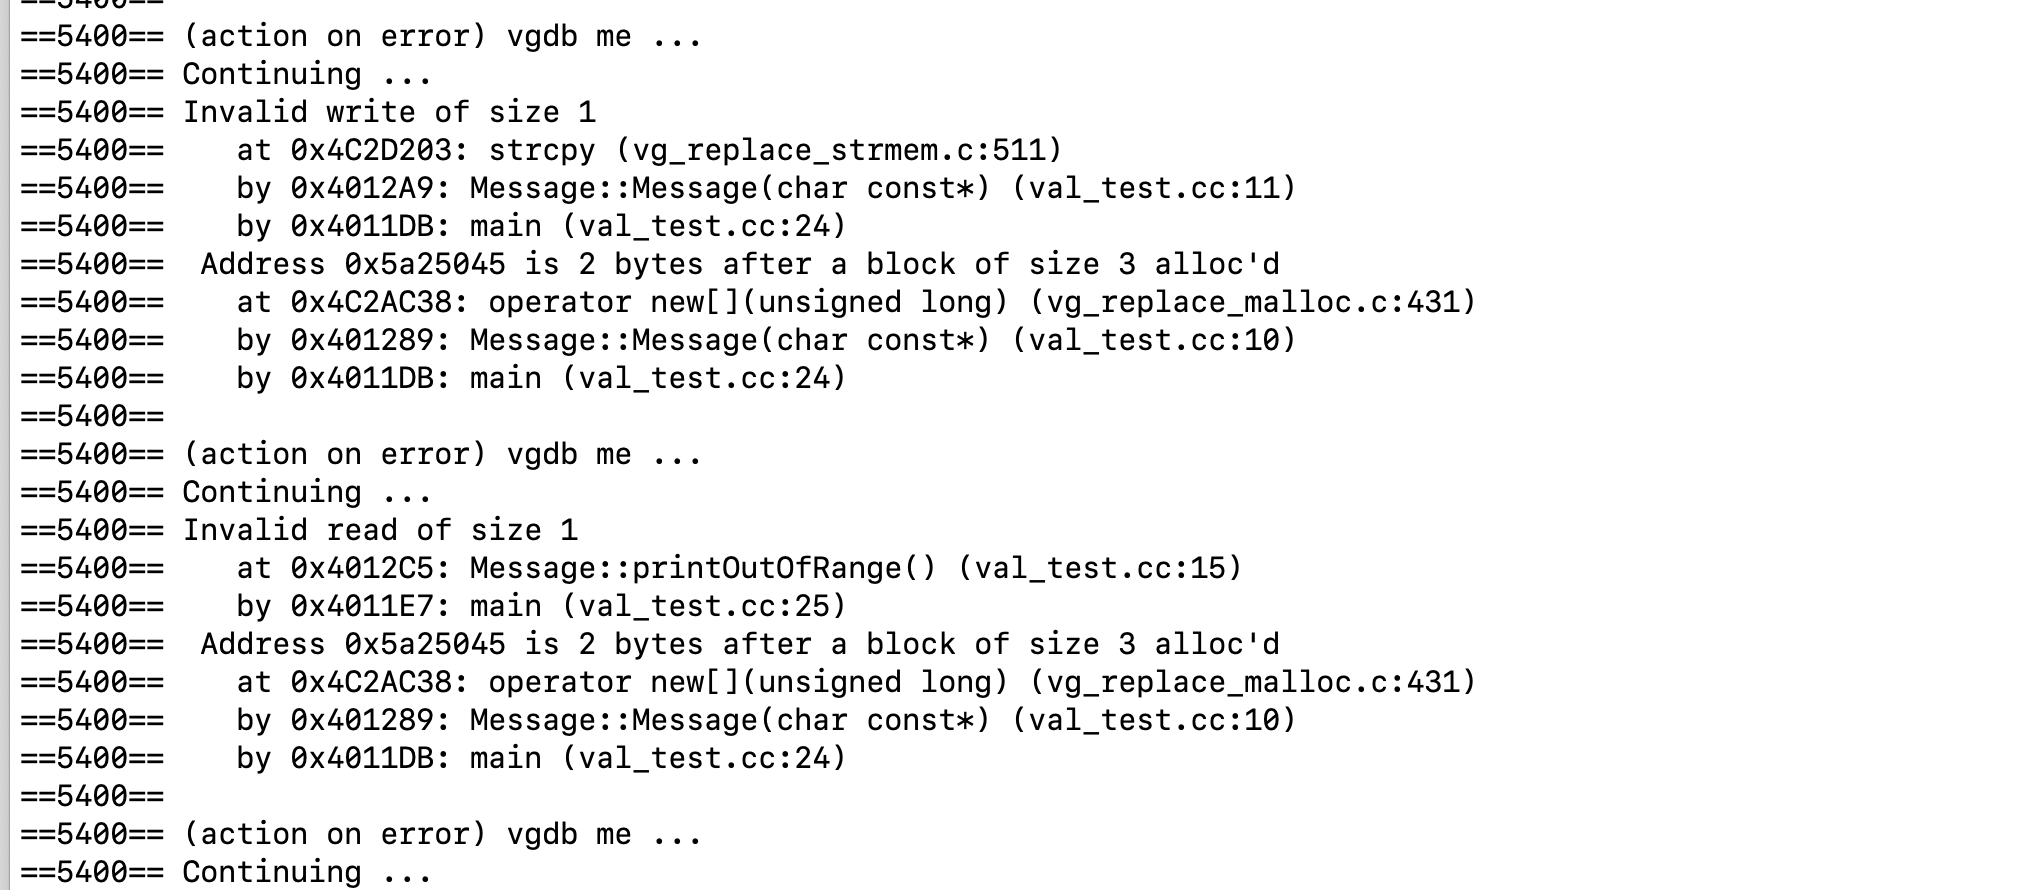
Paste the target line above into gdb, then continue, and we can see the code for the corresponding line along with the further information valgrind keeps printing.
This section walked you through memory problems in practice. If it helped you, feel free to share it.